 The Science of Acceleration
The Dashboard
A Birds Eye View Of Your Account.
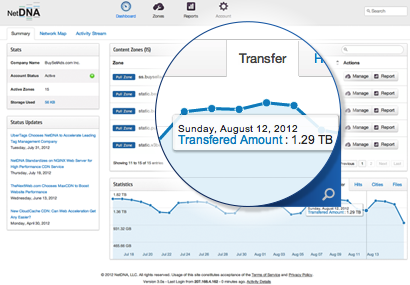
The CDNPanel Dashboard lays out all the important information of your account on the single page. Every relevant information is laid out in intuitive way. Zones, amount of data transferred, % of cache and non-cache hits, and relevant zones, gives you all the snap shot of your account. If you would like more detailed information, just click on it, and it will take you there.
Summary
The Dashboard summary tab allows you to view
Account Stats
Number of Zones
Bandwidth Transfered
Cache Hits Percentages
Network Map
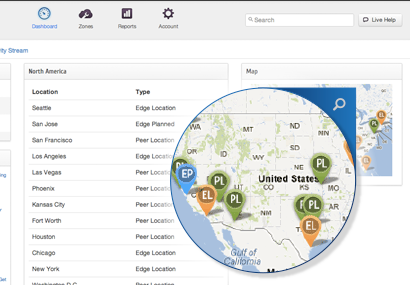
This tab allows you to view where our points of presence are. It also shows where our main peering locations are.
North America
Europe
Asia-Pacific
Activity Stream
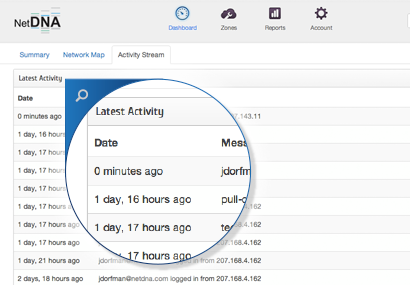
The Dashboard Activity Stream tab allows you to view
The date of the event
Who logged in from what IP
Zone creation, modification or deletion.
User creation, modification or deletion.